Infographics
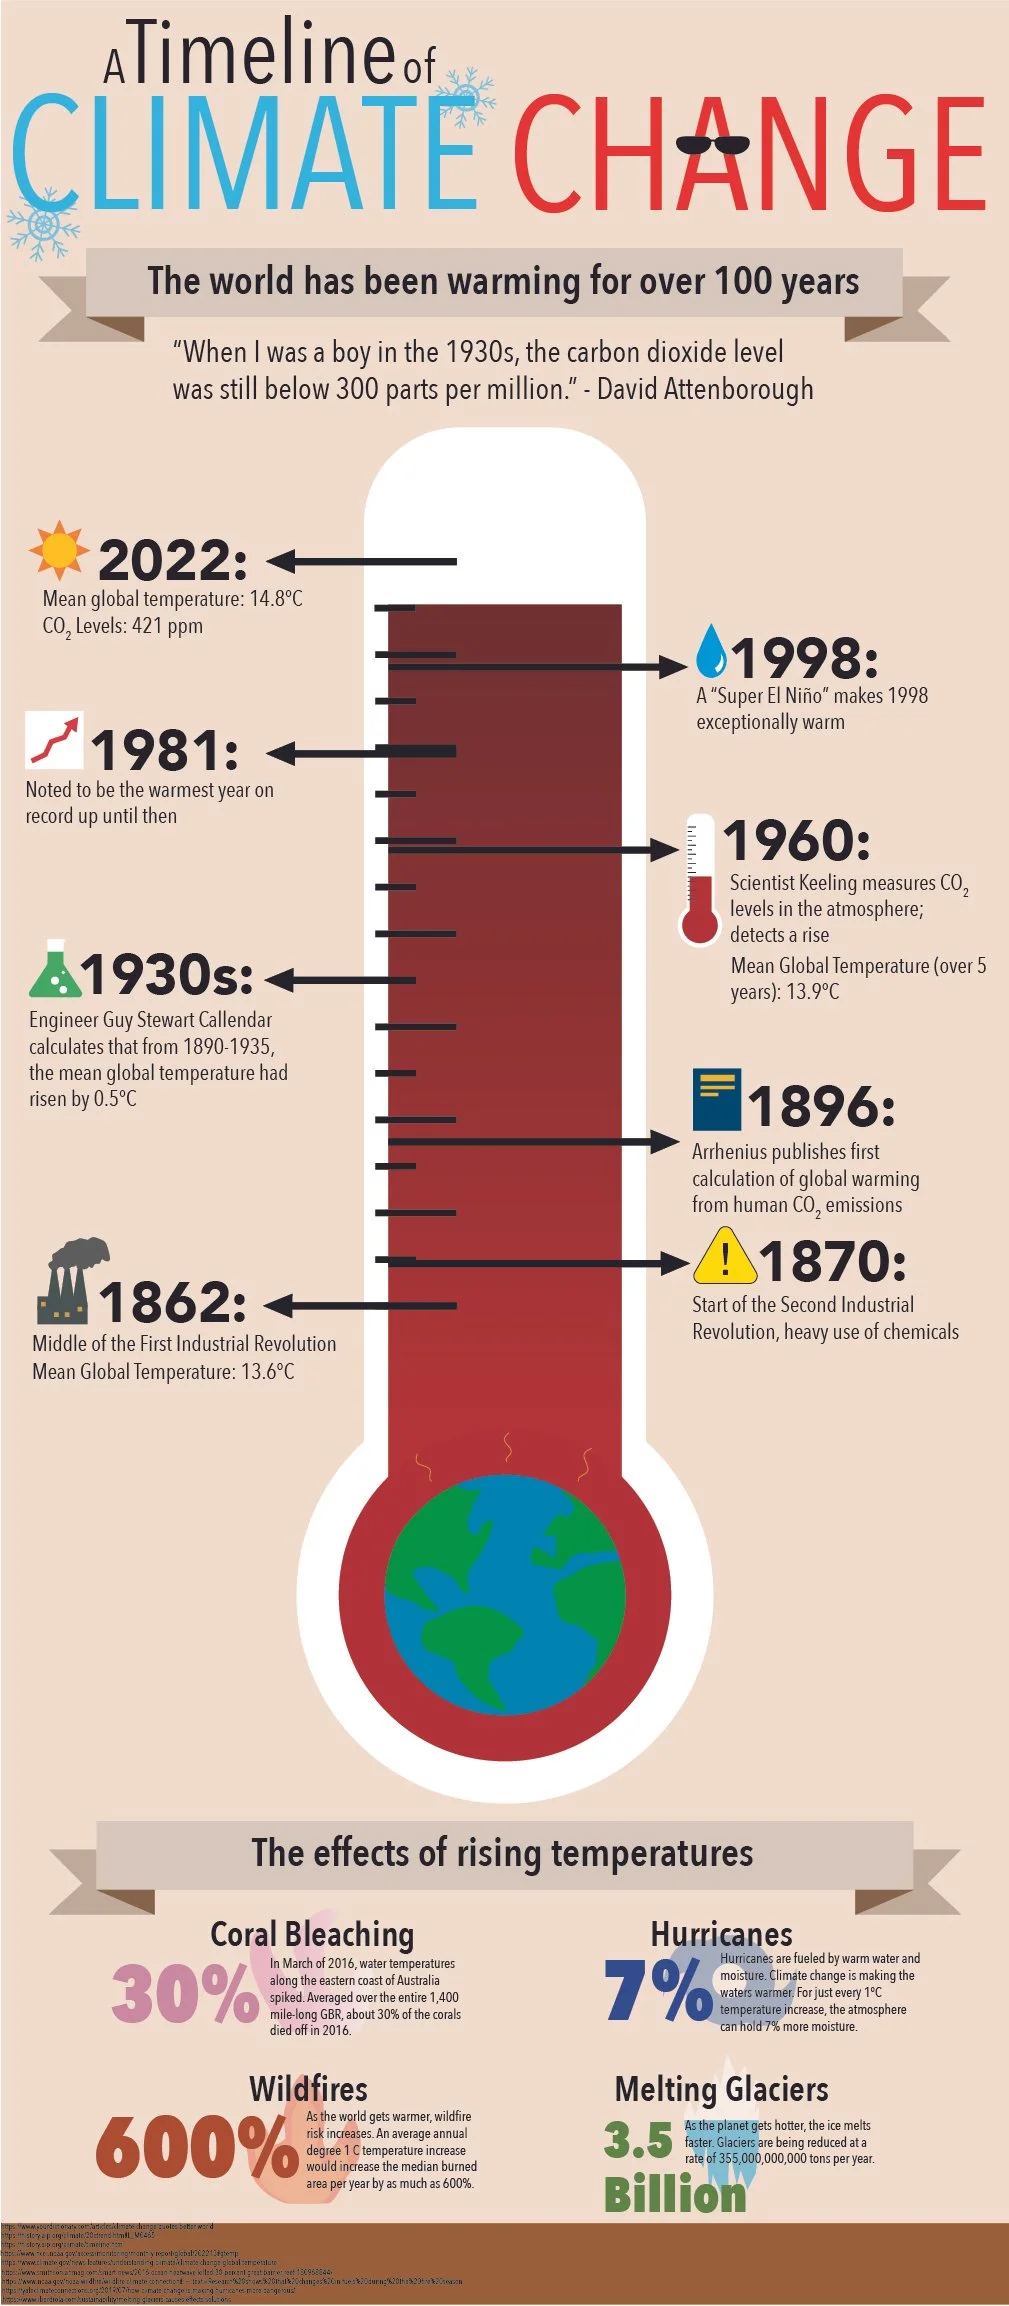
Climate Change: A timeline visualized as a thermometer, with various temperatures corresponding to key events. Other interesting facts about this topic are displayed at the bottom.
A nice tan background, coupled with banners, gives a hint of a historical feel, without being visually overwhelming. All graphics were drawn and compiled in Adobe Illustrator, and sources of information are listed at the bottom.
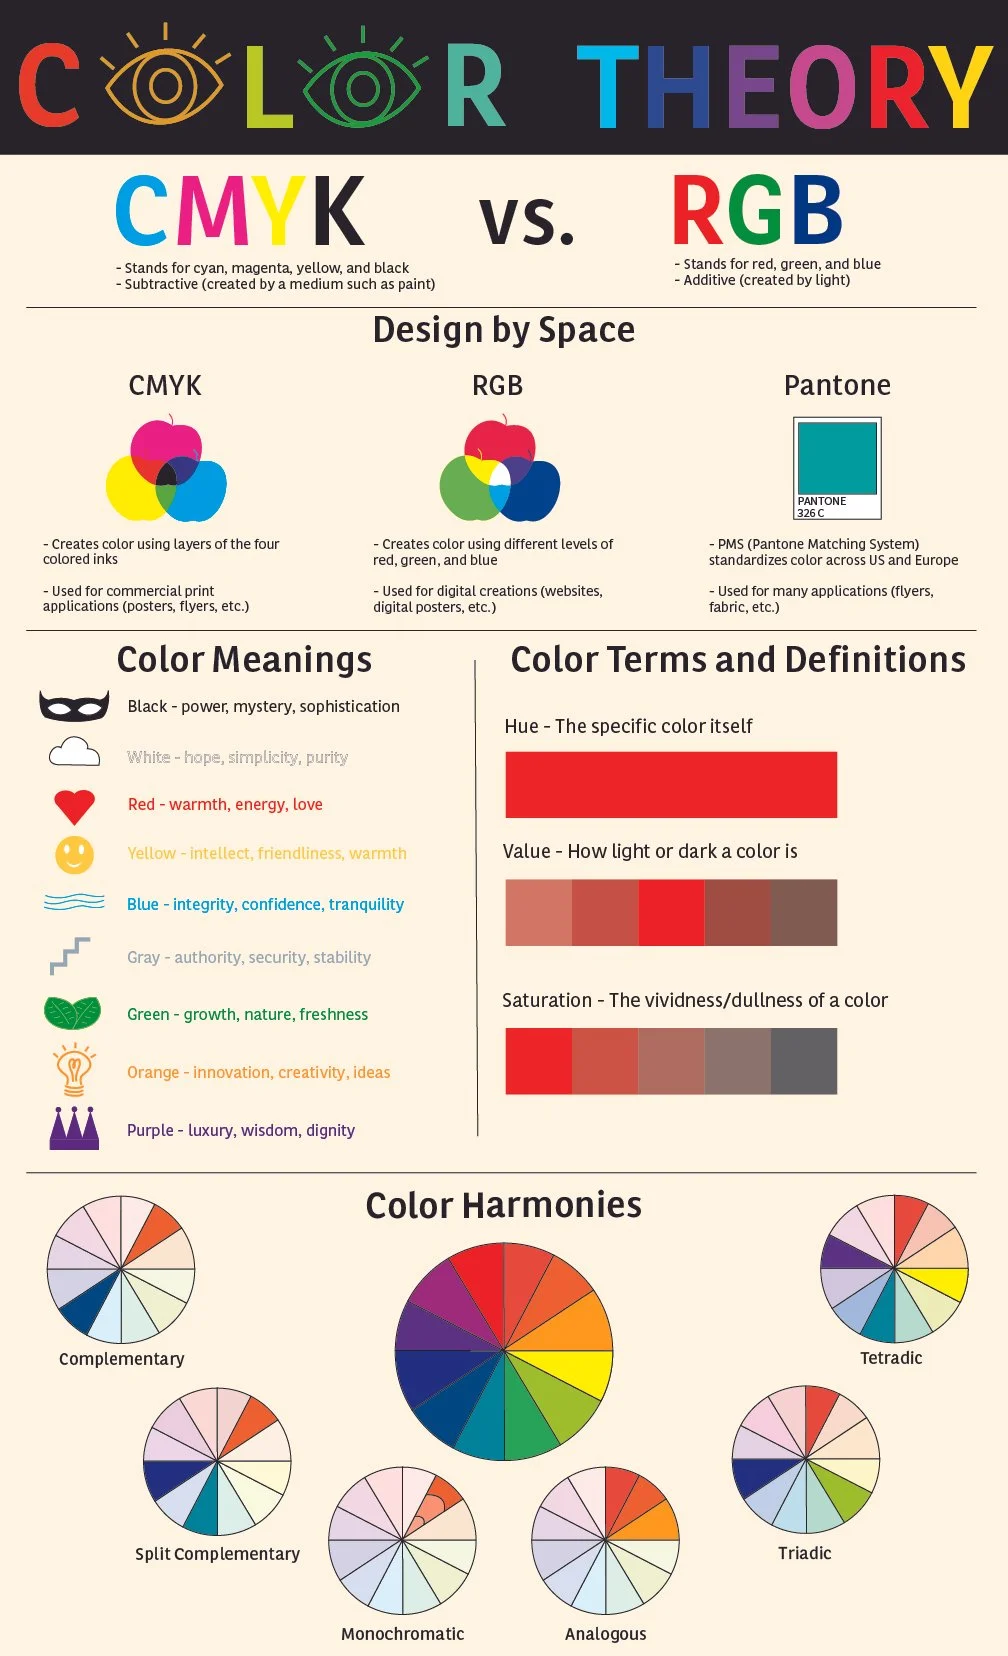
Color Theory: This concept is visually explained via its most basic elements - color spaces, terms, meanings, and harmonies. All graphics drawn and compiled in Adobe Illustrator.


